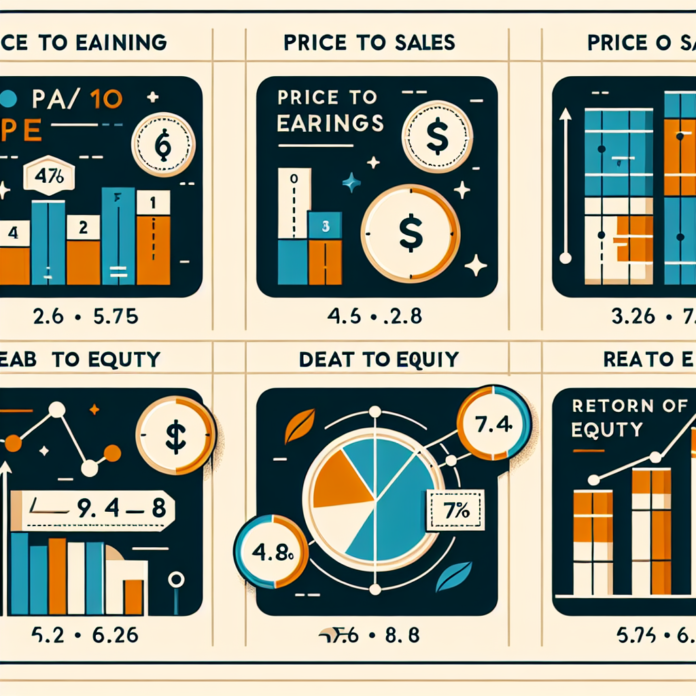
When it comes to evaluating stocks for potential investment, financial ratios offer invaluable insights into a company’s financial health and prospects. These metrics, distilled from a company’s financial statements, can help you make more informed decisions by comparing indicators of profitability, liquidity, efficiency, and valuation. This piece will guide you through key financial ratios and demonstrate how to use them effectively in your stock analysis.
Profitability Ratios: Measuring Earnings Power
1. Earnings Per Share (EPS): EPS indicates how much money a company makes for each share of its stock. It’s calculated by dividing the company’s net income by its total number of outstanding shares. A consistently increasing EPS could signify a company’s growth potential.
2. Return on Equity (ROE): ROE measures a company’s ability to generate profits from its shareholders’ equity. A higher ROE suggests a more efficient company in turning equity financing into profits.
To understand these ratios better, Morningstar offers a deep dive into profitability metrics and individual company analyses.
Liquidity Ratios: Evaluating Short-Term Financial Stability
1. Current Ratio: This measures a company’s ability to pay off its short-term liabilities with its short-term assets. A current ratio above 1 indicates that a company has more assets than liabilities, which is typically a sign of good short-term financial health.
2. Quick Ratio: Also known as the “acid-test ratio,” it assesses a company’s capacity to meet its short-term obligations with its most liquid assets, excluding inventories. A higher ratio represents a better position to cover liabilities.
Detailed ratio calculations and industry benchmarks can be found on financial analysis platforms such as Investopedia.
Efficiency Ratios: The Turnover Tells the Tale
1. Inventory Turnover: This ratio shows how often a company’s inventory is sold and replaced over a certain period. A higher turnover indicates efficient inventory management and product demand.
2. Receivables Turnover: This ratio reveals how effectively a company collects on its receivables. Higher turnover suggests efficient credit and collection processes.
For comparison with industry averages, consider visiting Yahoo Finance, which provides financial ratios and other vital statistics for numerous companies.
Valuation Ratios: Understanding Market Expectations
1. Price-to-Earnings (P/E) Ratio: The P/E ratio compares a company’s current share price to its per-share earnings. A high P/E could suggest that the stock is overvalued, or that investors are expecting high earnings growth in the future.
2. Price-to-Book (P/B) Ratio: This ratio compares a firm’s market value to its book value. A lower P/B ratio could mean the stock is undervalued.
3. Price-to-Sales (P/S) Ratio: P/S provides a sense of the value placed on each dollar of a company’s sales. This is especially useful for companies that are not yet profitable but generate significant revenue.
Business news and analysis provider The Motley Fool discusses the nuances of different valuation metrics and what they might mean for individual stocks.
Conclusion
Financial ratios serve as the building blocks for sophisticated stock analysis. Whether you’re a seasoned investor or a keen beginner, utilizing these ratios to scrutinize balance sheets, income statements, and cash flow statements can be a game-changer. However, it is vital to consider ratios in context, looking at industry standards, economic conditions, and company specifics. By integrating financial ratio analysis into your investment strategy, you can enhance your ability to spot opportunities, avoid potential risks, and ultimately make more astute investment decisions. For a well-rounded evaluation, always refer to comprehensive resources and consider multiple financial dimensions before taking the leap into any stock.
Seeking Alpha also offers a rich collection of analytical tools and expert commentary for investors who wish to incorporate financial ratio analysis into their stock research repertoire.


 AGF-B.CO