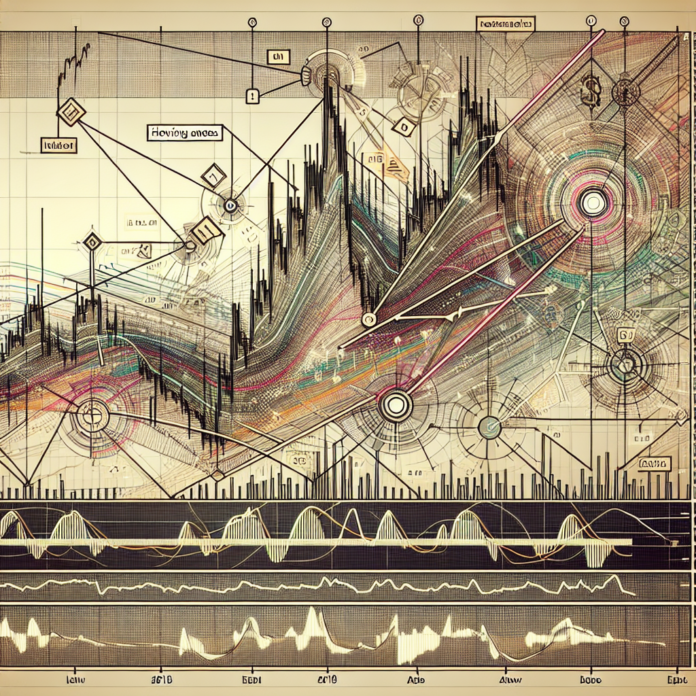
Cryptocurrency charts are the canvases on which the stories of market movements are painted. For traders and investors, understanding how to read these charts is crucial to making informed decisions. This graphical guide will help you decipher the essential patterns and trends in crypto charts so you can navigate the volatile crypto markets with confidence.
Understanding the Basics of Crypto Charts
Before diving into complex patterns, it’s essential to understand a chart’s basic structure. Crypto charts typically include the price on the vertical axis (y-axis) and time on the horizontal axis (x-axis). Prices can be displayed in different forms like line charts, bar charts, or the most commonly used candlestick charts. In a candlestick, a green or white body represents a price increase during that period, while a red or black body indicates a decrease.
- Candlestick Charts: Offering information on open, high, low, and close prices, candlestick charts are favorite among traders. They can indicate market sentiment and potential price reversals.
- Volume: Typically shown at the bottom of a chart, volume bars can confirm the strength of a trend based on trading activity.
Identifying Crypto Chart Patterns
Crypto charts often form patterns that traders use to predict market behavior:
- Trend Lines: Linear representations of price direction over time. An upward trend line indicates increasing prices while a downward line signifies decreasing prices.
- Support and Resistance: Support lines are price levels where a downtrend can be expected to pause due to a concentration of demand. Resistance lines are the opposite, where an uptrend is expected to stall due to a sell-off. Learn about support and resistance with Investopedia.
- Moving Averages: Indicators that smooth out price data to form a single line that tracks the trend. Simple Moving Averages (SMA) and Exponential Moving Averages (EMA) are the most commonly used. Moving Averages explained by StockCharts.
Recognizing Bullish and Bearish Trends
- Bullish Patterns: These are signals that might indicate an upcoming price increase. The ‘Head and Shoulders’, ‘Cup and Handle’, and ‘Ascending Triangle’ are a few patterns suggesting bullish trends.
- Bearish Patterns: Patterns like ‘Inverted Head and Shoulders’, ‘Bearish Engulfing’, and ‘Descending Triangle’ can be predictors of a downward price trajectory.
Technical Indicators for Trend Analysis
Technical indicators are mathematical calculations based on historical trading data such as price and volume, which can give traders better insight:
- Relative Strength Index (RSI): Measures the magnitude of recent price changes to evaluate overbought or oversold conditions.
- Moving Average Convergence Divergence (MACD): A trend-following momentum indicator that shows the relationship between two moving averages of a currency’s price.
- Bollinger Bands: Consist of three lines—the moving average, an upper limit and a lower one—which can highlight market volatility and periods of price consolidation.
Conclusion
Reading crypto charts is part art, part science. While charts can provide valuable information, it’s important for traders to understand that no pattern or indicator is foolproof. Coupled with an understanding of market news and fundamental analysis, these graphical tools can guide your trading decisions. Remember, practice is key when it comes to interpreting charts, so use resources like TradingView for live charts and tools to refine your analytical skills. With these instruments at your disposal, the world of crypto trading becomes a more navigable and potentially profitable landscape.


 AGF-B.CO