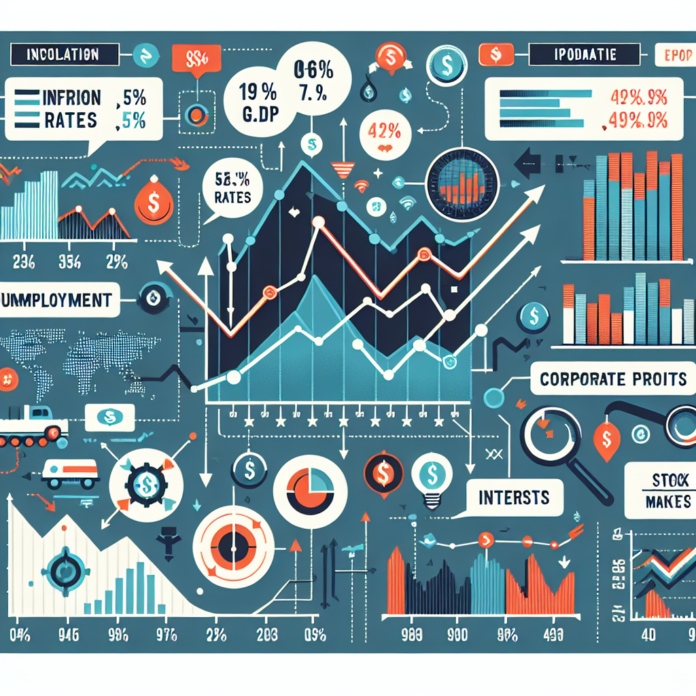
The financial markets are a complex network influenced by various factors that can impact investment decisions. To navigate this landscape effectively, investors rely on market indicators as guiding metrics that signal the market’s performance and potential future direction. From classic stock market indices to intricate economic data points, understanding market indicators is essential for any astute investor.
The Role of Stock Market Indices
Stock market indices are perhaps the most recognized market indicators. These indices, such as the S&P 500, Dow Jones Industrial Average, and NASDAQ Composite, track the performance of a selection of stocks to represent the health of an entire market sector or the market as a whole. For instance, investors often look at the S&P 500 as a gauge for the overall U.S. equity market since it includes a broad cross-section of leading U.S. companies.
Economic Indicators to Watch
Beyond stock market indices, a range of economic indicators can also provide insights into market trends and potential shifts. Key metrics such as gross domestic product (GDP), unemployment rates, consumer price index (CPI), and housing starts can all have a profound impact on market sentiment. For up-to-date economic data, the U.S. Bureau of Economic Analysis offers a wealth of information.
The Bond Market and Yield Curves
The bond market is another crucial indicator of economic health and market trends. The yield curve, which plots the interest rates of bonds with equal credit quality but differing maturity dates, can indicate investors’ expectations for future interest rates and economic activity. An inverted yield curve has historically been seen as a precursor to a recession.
For detailed bond market data, platforms like Investing.com provide a real-time look at how bond yields are trending.
Technical Indicators for Stock Analysis
Investors also use various technical indicators to forecast the future price movements of stocks. These include moving averages, relative strength index (RSI), and moving average convergence divergence (MACD), among others. By analyzing historical price data and volume, technical analysts seek to identify patterns and signals for when to buy or sell a security.
Websites like TradingView offer intuitive charting tools that give traders access to a broad range of technical indicators.
Sentiment Indicators
Sentiment indicators measure the bullishness or bearishness of a particular market or asset. The Volatility Index (VIX), also known as the “fear index,” gauges market risk and investors’ sentiments towards volatility. Another example is the Put-Call ratio, which measures the trading volume of put options versus call options to gauge the general mood of investors.
Market Indicators and Portfolio Management
Market indicators are valuable tools that can inform investment strategies and help manage portfolio risk. By keeping a close eye on these indicators, investors can make data-driven decisions to optimize their portfolio allocations. However, no single indicator can provide all the answers — a combination of different indicators, alongside fundamental analysis, is often the most prudent approach.
Conclusion
In conclusion, market indicators are vital navigational tools that can help investors comprehend the financial markets’ complexities. Whether looking at broad economic data or analyzing specific stock trends, a sound understanding of these indicators is indispensable for crafting a robust investment strategy. Keeping abreast of market movements through trusted financial news sources and analytical platforms can position investors to respond swiftly to market changes, ultimately leading to more informed and potentially successful investment decisions.


 AGF-B.CO